Rent Growth Outlook: What Goes Up...Comes Down
by Donald Davidoff | Jan 30, 2017 12:00:00 AM

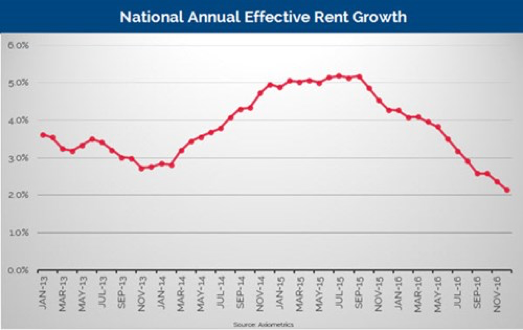
It’s happened. Axiometrics has reported that, for the first time since July 2010, year-over-year (YOY) rent growth is below the historical average. At 2.1% for December, we are not below the long-term benchmark of 2.2%. If that doesn’t mark the end of an almost 8-year bull run, I don’t know what does.
The strange thing to me is the relatively calm reaction from the industry. Having just come back from the NMHC Annual meeting (the industry’s largest gathering of senior executives in our industry), I’m surprised at the level of optimism. There’s some discussion on concerns about the future, but I perceive less than back in the fall when that tired metaphor, “what inning are we in?” dominated conversation.
In fact, what I saw was a record 5200 delegates, many in the “blue blazer and white shirt” uniform of the deal guys (and while there were a few “deal women” it was still mostly guys). NMHC didn’t draw a record attendance because of a big increase in operators attending, instead the obvious driver was the health of the banker, broker, buyer, seller, developer dimension of our business.
I’m usually an optimist, always noting that this industry follows more of a “what goes down must bounce back up” rule than a “what goes up must come down” attitude, but I’m genuinely nervous. Part of it may just be because no one else seems to be (that’s often a sign of market exuberance), but it’s also data driven:
- Twice in the past week, I’ve been reviewing some key statistics for clients. One almost exclusively in “core” markets and the other with a majority in Sunbelt markets. In both cases, renewal prices are materially higher than new lease prices. Having been through the 2002-2003 and 2008-2009 cycles, I have always viewed such an “inverted” situation as a clear sign of the loss of pricing power.
- I also recently had cause to dig into market-level rent change data as reported by Costar, Axiometrics, etc. to the individual comp rents tracked by communities during their normal weekly shops. In one particular market, the former reported rent declines since August on the order of 1% while the latter showed the declines to be more like 6.6%. Since I was looking at A-class comps, I’m sure some of this is due to the well-reported fact that A-class communities are currently underperforming on rent growth when compared to B- and C-class assets; but that gap is more than can be accounted for by that alone (Axiometrics reports no more than about a 100bps gap between the asset classes). My hypothesis is that we’re starting to see concessions that aren’t necessarily reported through normal calls or ILS feeds. That’s also a sign that things are likely going to get worse before they get better.
- Burying the lead, the “smoking gun” to me is the slope of the rent declines. Take a look at the figure below which was in Axiometrics’ report (I saw the same trajectory in a slide Ron Witten reported at the NMHC meeting).
 Source: Axiometrics
As many of you know, I’m a trained aeronautical/astronautical engineer, and originally worked on guidance and control systems. A fundamental rule of airplane trajectories is that, to have a “soft landing,” the plane must first slow down its rate of descent. That doesn’t appear to be happening with rents, at least not yet. Maybe it will, but to stretch the airplane metaphor, we’re running out of altitude.
There are some positive signs. Wage growth is above inflation, and smaller markets don’t have the same level of supply challenges as larger markets. Interest rates are still low continuing a long-term trend of favorable cap rates.
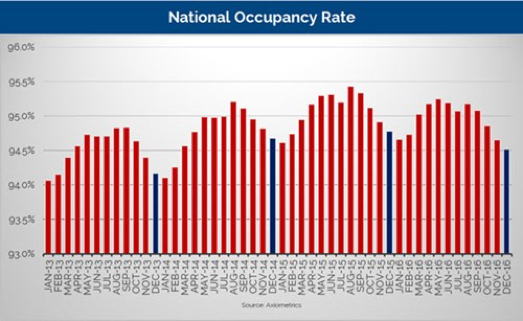
But major markets are down, and occupancy is at lowest since Feb 2014 (see the occupancy chart Axiometrics reported below):
 Source: Axiometrics
And of course there’s the uncertainty of the geopolitical situation and resulting potential impacts on consumer confidence and GDP. So pardon me if I’m a bit concerned that the consensus that we’ll have a soft landing is more a product of relentless optimism than any data.
At this point, you’re either as nervous as I am or you reject my thesis and cling to your belief that the landing will indeed be soft.
If you favor the latter, ask yourself what the downside is of believing me versus the upside of ignoring the warning. I propose that there’s a strong asymmetry between those two—in favor of continuing to hope for the best, but actually planning for the worst.
We’ve all been through downturns before. Each time, it seems like we scramble to create the playbook on the fly. But we all know what that playbook looks like, so let’s put it together now. Sober plans in advance usually work out better than quickly patched together ones in the heat of battle. If you’re looking for help on proven strategy and tactics for the downturn, please don’t hesitate to reach out to us. We’d love to help!